Bala's Curve: How Leasehold Value Decays in Singapore
Quick answer: Bala’s Curve is the shape traced by SLA’s Leasehold Table — the official reference for how much a leasehold is worth as a percentage of freehold value as its lease shortens.
The point most people miss: that percentage applies to today’s freehold value, not the price you once paid.
A buyer sits across from me with two options.
One is an older leasehold, noticeably cheaper, in a location they love.
The other is newer, or freehold, and costs more than they wanted to spend.
The cheaper one feels sensible — until the quiet question surfaces: what is the shorter lease actually costing me, and am I paying for years I’ll never use?
That question has a structured answer, and most of it lives inside one old table.
This is the version of how leasehold value decays in Singapore — and how to read a leasehold price before you commit, not after.
A note on names. The official term is SLA’s Leasehold Table, known in the industry as Bala’s Table.
“Bala’s Curve” is simply the curve that table draws.
I’ll use both, because they’re the same thing.
Table of Contents
The numbers that matter (read these first)
Two sets of figures decide a leasehold’s value: the Bala percentages, which set what a lease is worth versus freehold, and the financing markers, which decide who can buy it later.
Both are official, and both belong in your first five minutes on any leasehold.
The Bala percentages — leasehold value as a percentage of freehold value, by years remaining, from SLA’s Leasehold Table as documented by the Centre for Liveable Cities.
As a leasehold property's remaining lease runs down, its value falls as a share of an equivalent freehold. A 99-year lease sits near freehold value; the gap widens with age and steepens past the halfway mark. The figures below follow Bala's Table, a recognised valuation framework, not observed market transactions.
| Remaining lease | Value vs freehold | Visual guide |
|---|---|---|
| 99 years | 96.0% | |
| 90 years | 94.6% | |
| 80 years | 91.0% | |
| 74 years | 88.0% | |
| 60 years | 80.0% | |
| 50 years | 74.7% | |
| 40 years | 68.5% | |
| 30 years | 60.0% | |
| 20 years | 48.0% | |
| 10 years | 30.0% | |
| 3 years | 10.9% |
Note: These figures follow Bala's Table, a valuation framework, not observed market transactions. Actual pricing varies by property, location, and market conditions. Verify against the official source, your banker, or a qualified valuer before relying on them. This is not financial advice.
The fall is not a straight line. From 99 to 60 years the value slips gently, from 96.0% to 80.0%.
From 30 years down to 3 it drops off a cliff, 60.0% to 10.9%.
The closer a lease gets to zero, the faster the value falls toward it.
The financing markers decide your future buyer pool, and they move real prices as much as the percentages do:
- CPF can be used in full only if the remaining lease covers the youngest buyer to age95; below that, CPF is pro-rated, per the CPF Board.
- Once the remaining lease is below 20 years, no CPF can be used and no HDB loanis granted, per the CPF Board.
- Bank loan tenure shortens as the lease and the borrower’s age rise, and the loan is sized against the 4.0% medium-term interest rate floor, not the rate you actually pay, per MAS Notice 645.
That 4.0% sizes a loan; it does not value a home — hold on to that, it matters later.
This public checker applies the CLC-documented SLA Leasehold Table percentages to one reference value. It shows the table-implied relationship between leasehold and freehold value. It does not adjust for location, condition, buyer demand, financing, CPF usage, or a valuer's judgement.
Table-implied leasehold value
S$880,000
Based on 74 years remaining at 88.0% of freehold value.
| Remaining lease | Value vs freehold | What this means in the checker |
|---|---|---|
| 99 years | 96.0% | A fresh 99-year lease is treated as 96.0% of the equivalent freehold value. |
| 74 years | 88.0% | A 25-year-old 99-year lease has 74 years left and sits at 88.0% of freehold value. |
| 60 years | 80.0% | The lease is still above the steepest tail, but the percentage has moved down clearly. |
| 40 years | 68.5% | The lease is moving into a more sensitive zone where resale and financing checks matter more. |
| 20 years | 48.0% | The table value is below half of freehold value. Separate CPF and loan checks are needed. |
| 10 years | 30.0% | The curve is in the steep tail and should not be read as a normal resale valuation. |
Note: Figures are illustrative and should be verified against official sources, your banker, a qualified valuer, or your conveyancing lawyer before relying on them. This is not a valuation, financial advice, loan advice, CPF advice, or a prediction of what a property will sell for.
What Bala's Curve actually is
Bala’s Table is SLA’s official record of how much a leasehold is worth versus freehold, by remaining years.
The insight most people get wrong is the base: the percentage applies to what the same home would be worth as freehold right now, not to the price it was launched or last sold at.
When you buy land, you’re buying the right to use it — or collect its future rent — for a set number of years.
To compare a lease with a freehold, you discount that future rent back to a single value today, which is what the CLC reconstruction describes the table as doing.
Run it for every lease length against freehold, and you get the Bala percentages.
Here is the part to slow down on.
The percentage is age-to-age.
A lease with 74 years left is worth 88.0% — but 88.0% of what the same home would fetch as freehold today, not 88.0% of what you paid years ago.
This is the most common error I see.
Someone bought at S$1,000,000, the lease is now 74 years, so they assume it’s “worth about S$880,000.”
That’s wrong twice over.
The base isn’t the old price — it’s today’s freehold value, which may sit well above what they paid.
And the percentage describes the relationship between leasehold and freehold, not the change from your purchase price.
Get the base right and the curve makes sense; get it wrong and every conclusion is off.
Why a leasehold can rise in price even as its lease shrinks
Two things move at once.
The Bala percentage falls as the lease shortens, while the freehold base value moves with the market — up, down, or flat.
When the base rises faster than the percentage falls, the leasehold price still climbs; when the percentage falls faster, it turns down toward zero.
Rise, peak, decline.
People assume that because a lease is always shortening, a leasehold must always lose value.
In the early decades, often the opposite happens.
Picture the two forces.
Early in a 99-year lease the percentage barely moves — 96.0% at 99 years to 80.0% at 60 years is a slow drift over four decades. Meanwhile the freehold base, the “100%” the percentage sits on, moves with the market.
If that base rises over along hold, the rising base outweighs the gently falling percentage, and the leasehold price goes up — not because the lease got longer, but because the thing the percentage multiplies got bigger.
A simple, illustrative walk: a freehold base of S$1,000,000 with a fresh 99-year lease gives 96.0% × S$1,000,000 = S$960,000. Years later the lease has aged to 60 years(80.0%) and, say, the base has moved to S$1,500,000: now 80.0% × S$1,500,000 =S$1,200,000.
The percentage fell; the price rose. Then, past the mid-point, the percentage falls faster — and near the tail, very fast.
Eventually no plausible rise in the base offsets a percentage racing to zero, and the price turns down.
At lease end the land returns to the State and the value is, by design, gone.
(Illustrative; assumes a hypothetical base movement to show the mechanism — not a forecast.
The base can move up, down, or flat.
Where the 96 / 80 / 60 numbers come from
The famous 3.5% discount rate behind Bala’s Table was never published by its author.
It was reverse-engineered by CLC researchers in 2017, who flagged 3.5% as an “unverified possibility” — a close fit at the ends, a looser one in the middle.
The table dates to around 1948 and is believed drawn up by a Land Office employee named Bala — hence the nickname — but its rate was never documented, per CLC.
Working backward in 2017, CLC researchers found about 3.5% reproduced the published percentages closely at the short and long ends and called it the “most likely” rate, not a documented fact — Singapore’s long-run inflation and the Government’s cost of capital both sit near it.
One caution worth carrying: this is not today’s MAS stress rate, which was 3.5% in 2013 but was raised to 4.0% in September 2022 to size loans, per MAS — a different job entirely.
And in the mid-lease years the real table decays faster than a clean 3.5% model, so treat 3.5% as an informed reconstruction of the shape, not a precise valuation engine.
Using Bala to tell if a leasehold price has already overpaid for the future
Bala’s Table and a “is this price already priced in?” check are the same present-value equation solved for two unknowns.
Bala fixes the discount rate and near-zero rent growth and solves for value.
A buyer fixes the price and the rent and solves for the growth the price assumes. If that implied growth looks unrealistic, the price has paid for a future that may not arrive.
[WIDGET EMBED: Leasehold Value & “Is It Priced In?” Checker — see spec in publishingpack]
This is where the curve becomes a decision tool. The same equation that built the tablecan be run in reverse to test a price.
Value is net rent divided by the gap between your required return and the rent’s growth rate.
Bala fixes two inputs (a discount rate near 3.5% and effectively flat rent) and solves for value.
A buyer can fix two different inputs — the asking price and the net rental yield— and solve for the last one: the rent growth the price quietly assumes.
In one line: implied growth ≈ your required return − the net rental yield.
Price a leasehold to yield 3.0% net when you require 5.0%, and the price is assuming rent grows about 2.0% a year, every year, to justify itself. If that growth looks unrealistic for this location and lease, the price has priced in a future that isn’t guaranteed.
One distinction sharpens the whole exercise.
The State values land near 3.5% because that’s close to its own cost of capital, and it’s a patient, low-risk, perpetual landowner.
You are not the State.
A private buyer reasonably uses a higher hurdle — often around 5% to 6% — for higher borrowing cost, real risk, and a finite horizon, which means paying less than the State’s convention implies for the same future rent. (That 5%–6% is my advisory view, not an official figure.)
And keep the 4.0% MAS stress rate out of this entirely.
It is not a discount rate or a required return — it exists to size a loan prudently, per MAS.
Mixing the loan-sizing rate into a valuation is one of the most common ways people confuse themselves.
(Worked figures here are illustrative and opinion-based — see the note on the figures.)
The financing reality Bala doesn't show
Bala values the land. It says nothing about who can finance it later — and financing rules shrink the future buyer pool as a lease shortens.
CPF is pro-rated below age-95 coverage, vanishes entirely under a 20-year lease, and bank tenure tightens with age.
Real decay steepens around the practical 60- and 40-year marks.
A price is only as strong as the pool of people who can pay it next. Bala draws the value curve; financing rules quietly redraw your future buyer list.
While the lease comfortably covers a young buyer to age 95, CPF use is unrestricted. Once it doesn’t, CPF is pro-rated, so buyers bring more cash, per the CPF Board.
Once the lease drops to 20 years or less, no CPF and no HDB loan, which thins the pool sharply, per the CPF Board.
Bank tenure also shortens as age and lease age rise.
Two markers to watch (heuristics, not cliffs): real decay tends to steepen around the 60-year mark, where the pool of younger buyers who can stretch CPF to age 95 starts narrowing, and the 40-year mark, where financing and resale friction build.
These are practical inflection points to weigh — the only hard, sourced cutoff is the 20-year line above.
A word on CPF framing: the CPF you use and later return on sale isn’t a penalty — it’s your own retirement money being restored to your CPF account, ready for your next home or retirement.
The constraint keeps your retirement intact while you house yourself.
If you want to see that in your own case — what actually lands in your pocket after the CPF refund when you sell — you can run your own HDB sale proceeds.
To run those numbers for your own age and lease — the exact CPF cap, the loan tenure, the cash gap — is mapped step by step in our HDB age-95 rule guide.
Where Bala breaks in the real market
Bala is the shape of decay, not a price tag.
Collective-sale potential can lift a price above the curve, the mid-band fit is loose by the table’s own working, and — on a like-for-like basis — studies find real prices often discount leasehold more than the table, not less.
Use Bala for the slope, then let real transactions set the level.
I’d be doing you a disservice if I handed you the table as a valuation.
Real prices deviate from it constantly, for good reasons.
Three deviations matter most.
First, raw prices and like-for-like prices tell different stories.
A brand-new 99-year leasehold can look priced close to freehold — but that usually compares a new building against older freehold stock, where the new-build premium and condition swamp the tenure gap.
That gap between a new launch and an older resale unit is a decision in its own right, which I’ve unpacked separately in new launch versus resale.
Second, collective-sale and redevelopment potential can push a price well above the curve — an ageing leasehold with en-bloc prospects is priced on its future as land, not its remaining lease.
Third, the mid-band fit is loose, as the table’s own reconstruction shows the middle years decaying faster than a tidy 3.5% model predicts.
Research note. Strip out age and condition, and the picture changes.
A 2025 academic study of Bala’s Table — Kwong, Goh & Ti, International Real Estate Review — found the decay curve from actual transactions ran steeper than the table, especially in the 60-to-80-year band: on a like-for-like basis, the market often discounts leasehold more than Bala’s does, not less.
Read it as a caution, not a rule — it doesn’t mean every leasehold falls faster.
For HDB specifically, there’s a structural floor worth naming.
Unlike a private 99-year leasehold, an HDB flat returns to the State at lease end with no compensation. Renewal isn’t a backstop you can count on: SERS is compulsory but highly selective — only about 4–5% of flats have ever been chosen since 1995, and HDB has said there are currently no plans for more, as most sites with high redevelopment potential have already been selected.
VERS, the voluntary scheme for flats around 70 years old, carries less generous compensation and has not yet been rolled out.
Neither is guaranteed, so it isn’t something to pay a premium for.
The honest conclusion: the table carries legal force for one job — computing state land premiums under the Land Betterment Charge rules — but the resale market it’s so often quoted in isn’t bound by it.
Use Bala to understand how steeply a lease is likely to fall, then anchor the price to real comparable transactions.
The table tells you the gradient; the market sets the height.
A worked example, step by step
A 25-year-old freehold at S$2,500 psf implies that a 25-year-old 99-year leasehold — with 74 years left, so 88.0% on the table — sits at roughly S$2,200 psf.
Every figure here is illustrative, shown to demonstrate the method, not to value any specific home.
Take the most common comparison: same age, same area, one freehold and one leasehold.
Start with a freehold reference of S$2,500 psf.
A 99-year leasehold that’s 25 years old has 74 years left, worth 88.0% of freehold.
So its Bala-implied value is 88.0% × S$2,500 = S$2,200 psf.
Offered at S$2,200 psf, it’s broadly in line with the curve.
Offered at S$2,450 psf — almost the freehold figure — it’s asking you to pay nearly freehold money for a home with a lease quietly counting down.
Where does that freehold reference come from?
Two ways: look at recent transactions of similar freehold homes nearby via URA’s records, or back-solve — divide the leasehold price by the Bala percentage (here, S$2,200 ÷ 0.88 = S$2,500 psf).
Both give an estimate, not a valuation, and freehold prices move with the market too; the one structural difference is that no lease is counting down beneath a freehold.
A note on the figures: These figures are illustrative and opinion-based, produced with calculation tools — not a valuation or financial advice.
Human error is possible; verify against official sources before relying on them.
How I'd read a leasehold before buying
No formula, just the order I think in: years left, where that sits on the curve, an honest freehold base, the financing cliffs, what’s genuinely planned for the area, my own exit plan, and the real comparables.
Seven checks before the price ever becomes the conversation.
When a client brings me a leasehold, I run the same short walk, in this order:
- Years remaining — the exact figure, not the headline tenure.
- Where it sits on the curve — a gentle stretch, or heading into the faster fall past the mid-point?
- The freehold base — estimated from real comparables, so I know what the percentage is actually multiplying.
- The financing cliffs — does the lease cover a young buyer to age 95, and how far is it from the 20-year line?
- The area’s real prospects — separating what’s gazetted or being built (a plan) from what’s only marketing (a label) and what’s already been delivered (an outcome).
A credible growth story is often exactly why older developments stay in demand, so I don’t dismiss the future — I price it honestly: backing what’s genuinely committed, staying wary of a bare label, and remembering that a premium paid today is a bet on a future that still has to be delivered. - My own exit plan — how long I realistically intend to hold, and where the lease, the curve, and the financing cliffs will sit when I want to sell, because that shapes who I can sell to.
A lease that’s comfortable now can be near a cliff by the time I exit. - The real comparables — because the market, not the table, sets the level.
Only then does the asking price become the conversation. Most of the time, the price was never the first question — the lease was.
These seven checks look closely at the leasehold itself — but that’s one part of a sound buying decision, not the whole of it. I walk through the rest — the numbers, how a home fits your life, and your exit — in my framework for choosing the right property in Singapore.
Bala's Curve and leasehold value: frequently asked questions
Bala's Curve is useful for understanding how leasehold value may fall as the remaining lease shortens, but it should not be treated as the final resale price. Real transactions still depend on buyer demand, financing rules, CPF usage, location, property condition, and comparable sales.
What is Bala's Curve?
Bala's Curve is the shape drawn by SLA's Leasehold Table, often called Bala's Table, which records how much a leasehold interest is worth as a percentage of freehold value as its lease shortens. It is non-linear: value falls slowly at first, then accelerates as the lease nears expiry, when the land returns to the State.
Is a 99-year leasehold worth the same as a freehold?
No, but the gap on paper is smaller than many expect. On the table, a fresh 99-year lease is valued at about 96.0% of freehold. In practice, whether a leasehold property trades above or below that depends on the property, location, buyer pool, and comparable sales, which can differ from the table in either direction.
How much is a 60-year lease worth?
On the table, a lease with 60 years remaining is valued at 80.0% of freehold value today, not of any past purchase price. The real market price also reflects financing rules, location, condition, and demand, so treat 80.0% as the structural starting point, not the final figure.
Can I use CPF for a short-lease property?
Only within limits. CPF can be used in full when the remaining lease covers the youngest buyer using CPF to at least age 95. If it does not, CPF usage is pro-rated, provided the property has a remaining lease of at least 20 years. If the remaining lease is below 20 years, CPF Ordinary Account savings cannot be used for the purchase. HDB loan eligibility is assessed separately and should be checked before committing.
What happens when an HDB lease reaches zero?
The flat returns to the State at the end of the lease, unlike a freehold property. Renewal or redevelopment outcomes should not be assumed. SERS is selective and compulsory when announced, while VERS is intended to be voluntary for selected older precincts. An older HDB lease should never be priced on the assumption that redevelopment will happen.
Does Bala's Table decide my resale price?
No. Bala's Table is mainly a leasehold relativity reference used for state land and statutory premium calculations, including Land Betterment Charge adjustments. It does not set your resale price. Your resale price is set by real buyers, financing rules, CPF limits, location, demand, property condition, and comparable transactions. Use the table to gauge the lease-decay shape, then anchor pricing to the latest relevant transactions.
Note: This FAQ is for general education only. Leasehold values, CPF usage, loan eligibility, and resale pricing should be verified against official portals, your banker, a qualified valuer, or your conveyancing lawyer before you make a decision. This is not financial advice.
About the author
Rick Long is an Associate Senior Division Director at Huttons Asia.
Through YouHome.sg — Right Property Matters — he shares the frameworks, tools and field experience behind his advisory work, helping Singapore buyers and sellers across HDB, EC and private residential decisions with structured, calm, next-step guidance.
CEA Reg. R026818Z · Huttons Asia · YouHome.sg

For more Singapore property planning tips, follow me on Instagram.
@agent_rick_longWhere this leaves you
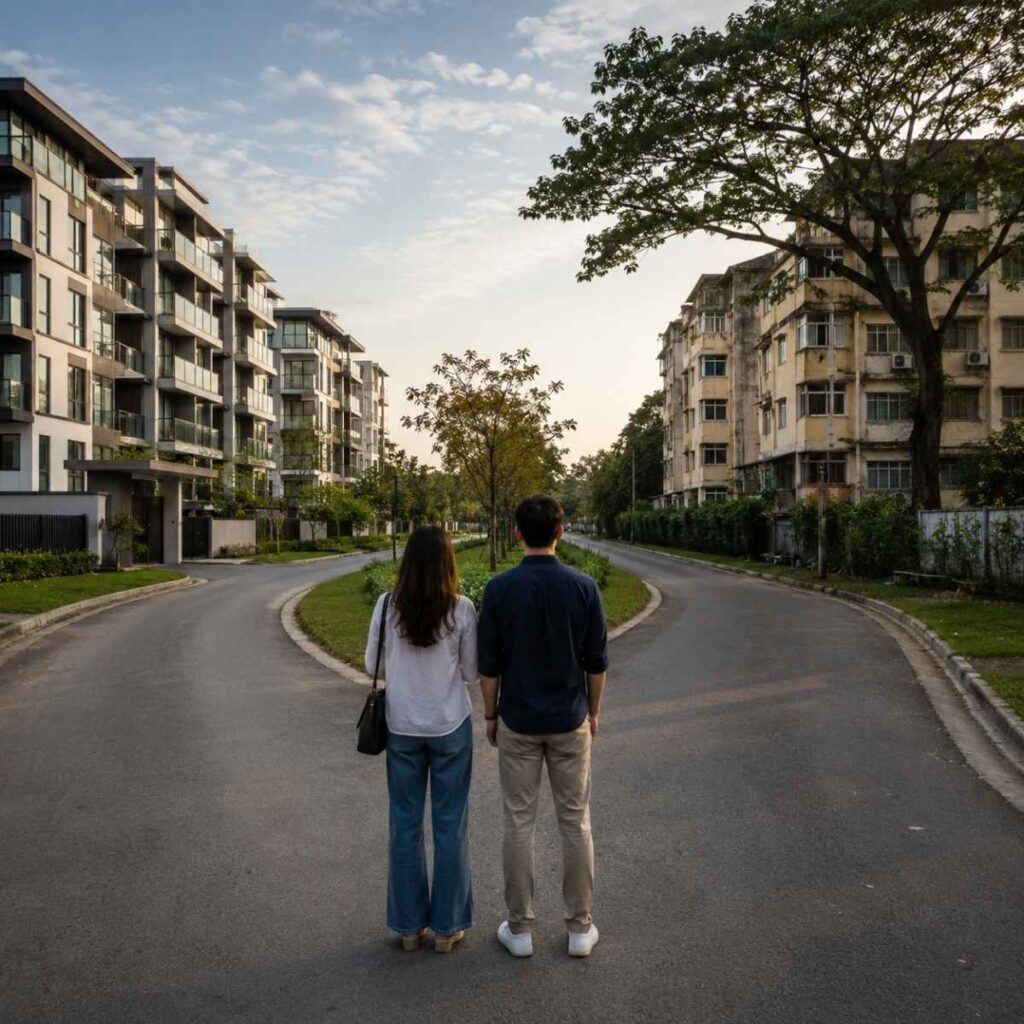
Bala’s Curve isn’t a warning to avoid leasehold or a reason to fear a shorter lease — it’s a lens. Used calmly, it tells you what a price is really asking of the future.
A shorter lease doesn’t make a worse buy, and a freehold doesn’t make a safer one. What matters is whether the price is honest about the years you’re actually buying.
Read it that way, and you’re not talking yourself out of a home you love — you’re walking in steady, knowing exactly what you’re paying for.
If you’re weighing an older leasehold against a newer or freehold unit and want a second opinion on where it sits on the curve, I’m happy to look at the specifics with you.
This article is Rick Long’s independent research and opinion — general information only, not financial, legal or investment advice.
Plans, timelines and figures come from public and official sources and can change; some details may be outdated or contain errors despite our checks.
Past performance is no guarantee of future results, and no returns are promised. Verify all details with official sources and seek qualified professional advice before deciding. We accept no liability for decisions made in reliance on this article.
What My Clients Say | Genuine Experiences
Real stories, real experiences—because your journey deserves nothing less than the best.














Awards and Accolades






Disclaimer: The case studies and information are for educational use only and i make no representation or guarantees with respect to the accuracy, applicability, or completeness of its contents. There shall be no liability for any loss or expense whatsoever, relating to investment decisions made by the reader.